Why 'One Size Fits All' Fails Building Decarbonization (And What to Do Instead)
Boston’s path to Net Zero is a data problem as much as an engineering one, and we can't solve new problems with the old way of doing things. By applying machine learning and clustering techniques, I've identified 9 distinct multifamily building prototypes that can move us toward decarbonization solutions that actually scale.

TL;DR
- Moving Beyond Averages: Instead of treating Boston’s multifamily stock as a monolith, this analysis identifies 9 distinct building prototypes based on energy, emissions, and size.
- Data-Driven Archetypes: By using KMeans clustering on BERDO 2.0 and Assessors data, we moved from raw numbers to actionable “energy fingerprints”.
- Scalable Decarbonization: These prototypes provide the foundation for modeling specific Energy Conservation Measure (ECM) that scale across buildings.
- Actionable Insights: The study captures the diversity of the city’s building stock, separating high-efficiency outliers from historical high-intensity landmarks.
What is BERDO 2.0?
If you work in Boston real estate or building science, you’ve likely heard the acronym BERDO (Building Energy Reporting and Disclosure Ordinance).
Originally passed in 2013, the updated BERDO 2.0 represents one of the most ambitious municipal climate policies in the United States.
Instead of just asking buildings to report their energy use, it mandates building owners find a path to Net Zero emissions by 2050.
Context
Buildings account for nearly 70% of Boston’s greenhouse gas emissions.
We in the AEC industry have made monumental strides in developing high-performance buildings. But to meet the city’s climate goals, we must address the existing building stock.
BERDO 2.0 sets declining emissions thresholds for non-residential and residential buildings, with significant financial implications for non-compliance.
The “Average” Trap
For owners and policymakers, the challenge is scale.
Boston has thousands of multifamily buildings alone, each with unique ages, mechanical systems, and envelopes.
Analyzing these one by one is too slow, but treating them all the same leads to inefficient “one size fits all” retrofit strategies that fail to hit targets or waste capital.
Data Science for Decarbonization
This post explore how we can use unsupervised machine learning to bridge this gap.
By clustering buildings into distinct prototype categories, we can identify which “type” of building a structure is and apply proven decarbonization scenarios at scale.
Clustering 101
To understand how we move from thousands of individual data points to nine actionable prototypes, we need to look at the mechanics of Clustering.
What is Clustering?
In the world of Machine Learning, clustering is a form of Unsupervised Learning.
Unlike “Supervised” models, where you train a computer to recognize a specific outcome, unsupervised learning allows the computer to find hidden patterns on its own without being told what to look for.
Think of it like sorting a giant bin of LEGO bricks. You don’t tell the computer to find “red 2x4 bricks,” instead you simply tell it to “group these based on how similar they are.”
The computer may group them by color, then by size, and finally by shape, until distinct “neighborhoods” of similar bricks emerge.
Enter KMeans: The “Center of Gravity” Approach
For this analysis, I used the KMeans algorithm. It is one of the most robust and, more importantly, interpretable ways to segment data.
Here’s how it works in three simple steps:
- Selection: We pick a number of “centers” (centroids) to place randomly in our data
- Assignment: Every building in the BERDO dataset “attaches” itself to the nearest center based on its features (like EUI, size, and emissions)
- Refining: The centers move to the average middle of their assigned buildings, and the process repeats until the centers stop moving.
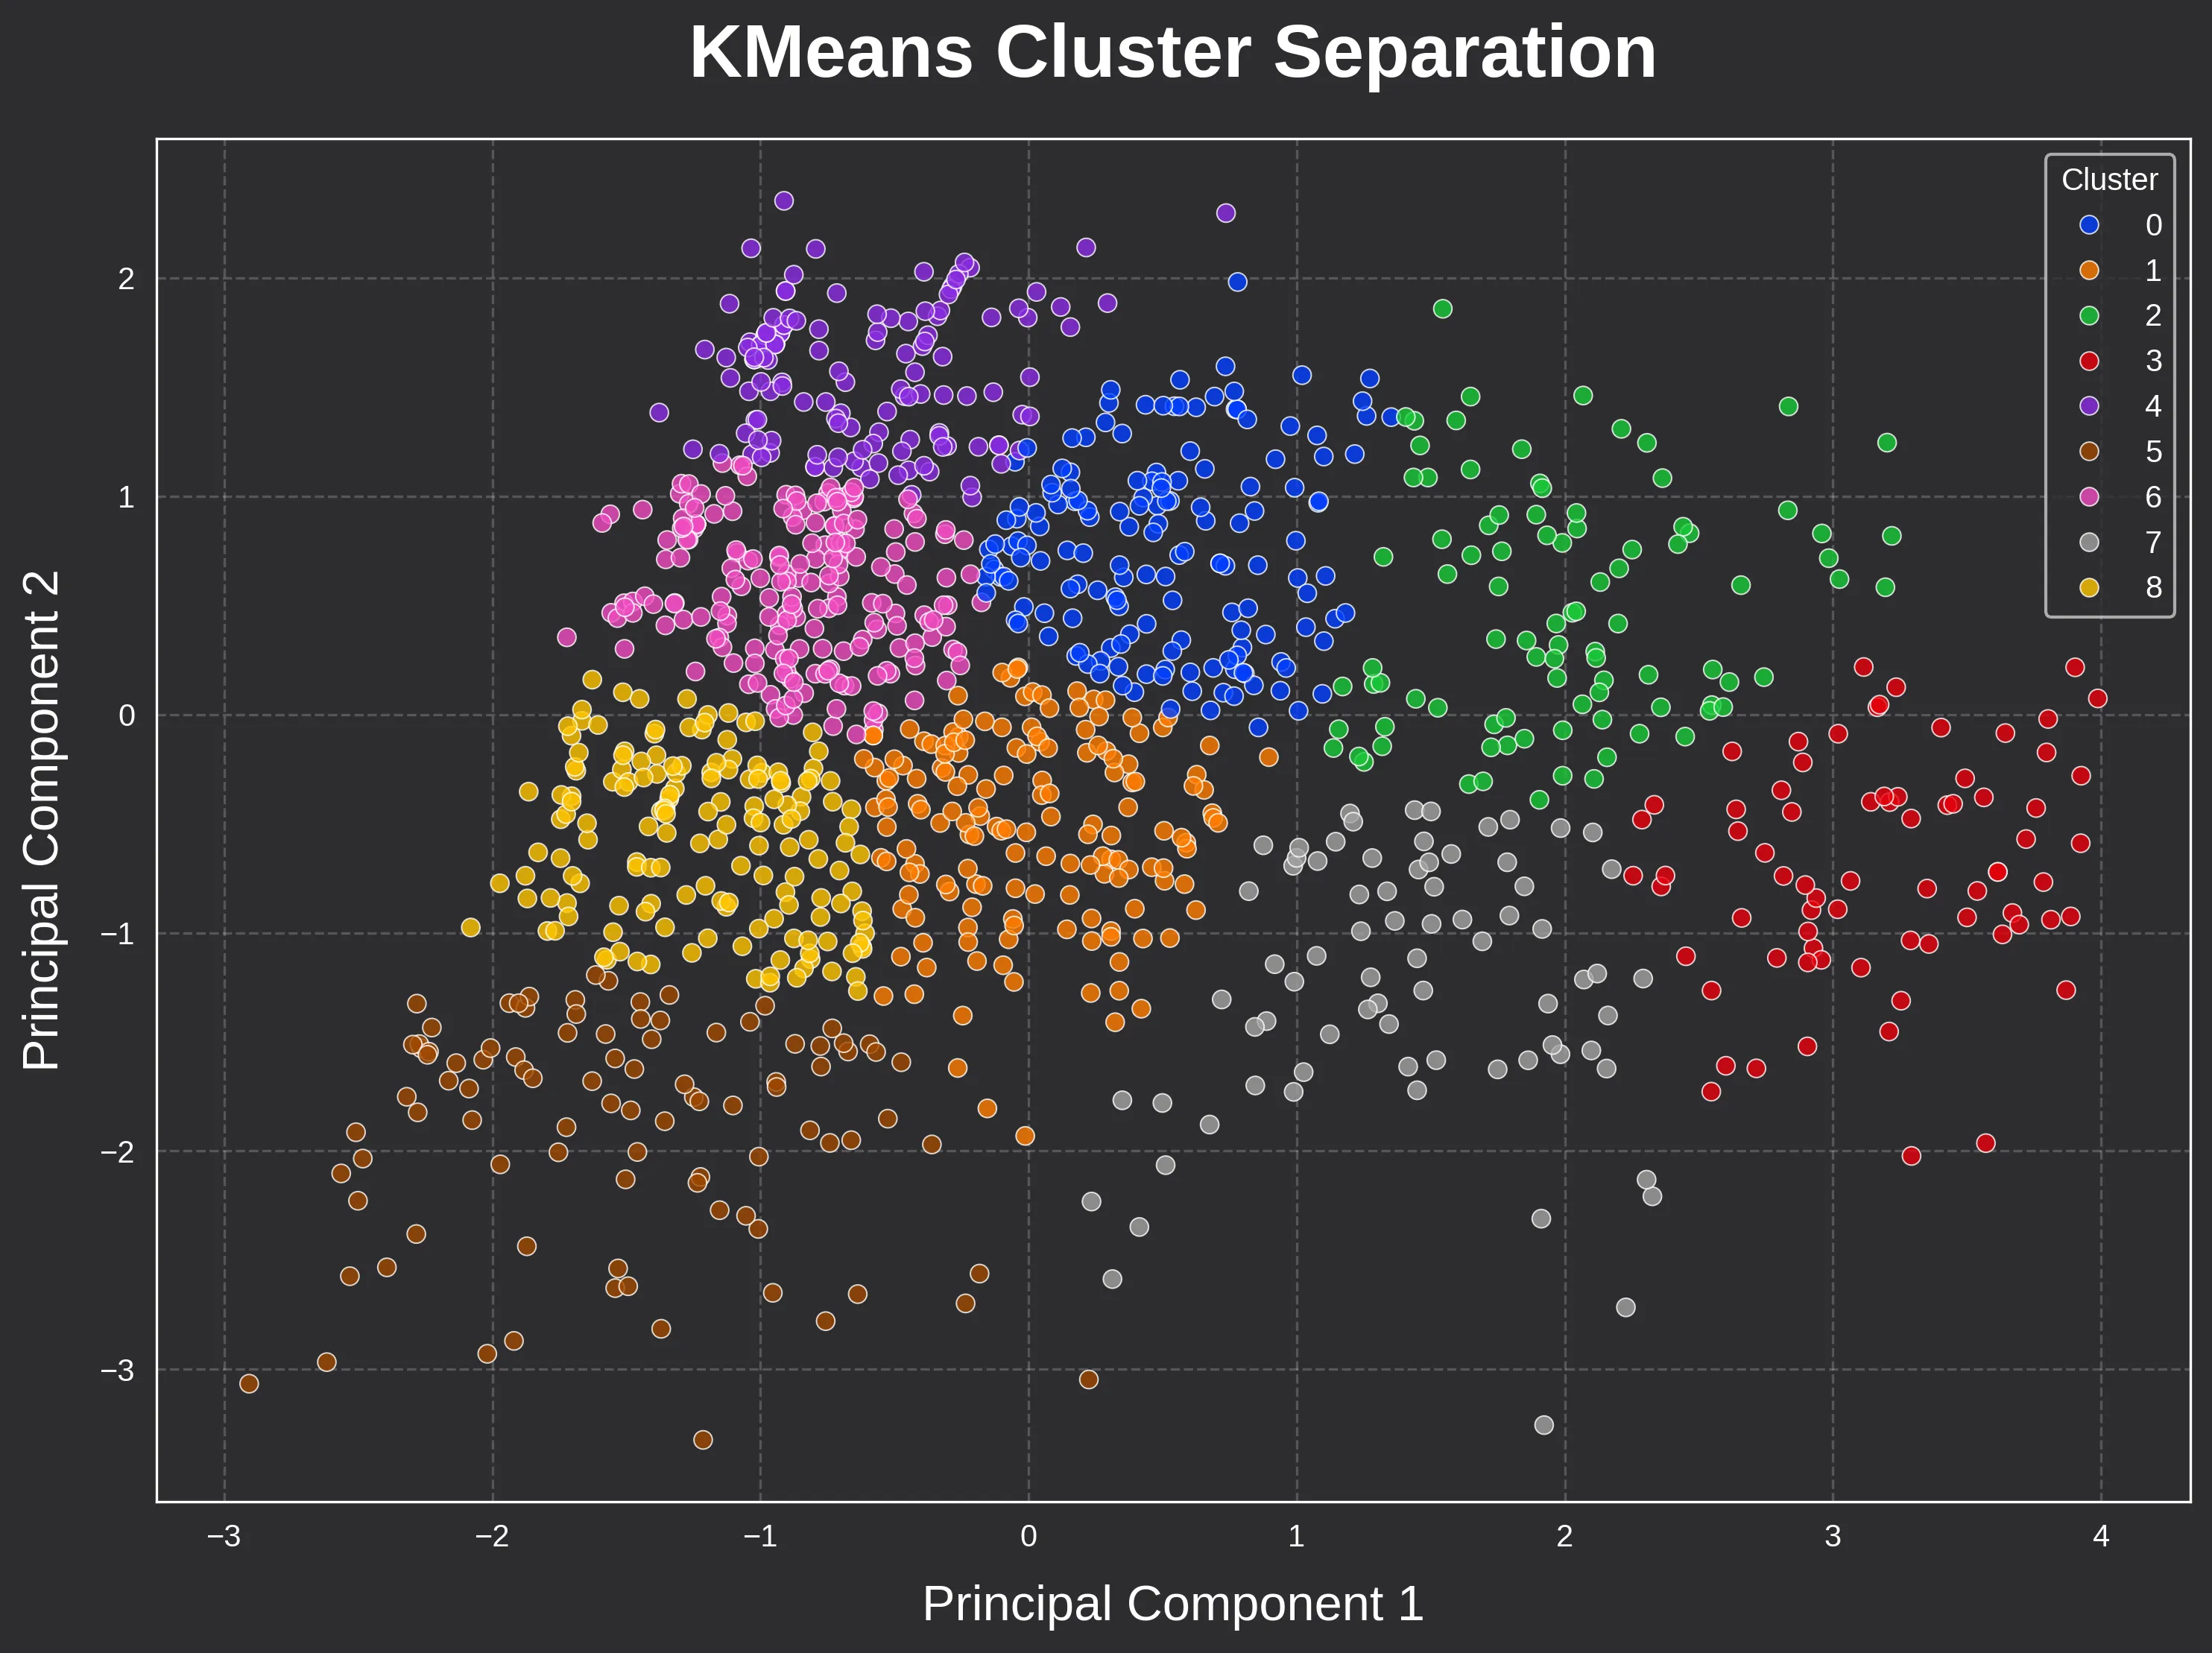
The result? The final “centers” become our 9 Building Prototypes. They aren’t real, individual buildings. They are the mathematical “average” of every building in that cluster, representing a specific energy fingerprint found in Boston.
Why Not Just Use Building Age or Size?
A common question that arises is: “Why not just group by year build?” While a building’s age is certainly important, it doesn’t tell the whole story.
Two buildings built in 1920 may have lived completely different “lives” where one might have undergone a deep energy retrofit with heat pumps, while the other still relies on an original steam boiler.
Clustering looks at the data holistically. It captures the intersection of physical attributes and actual performance, ensuring that our prototypes reflect how buildings actually behave, not just when they were built.
Observations and Insights
With the 9-cluster configuration established, we can move from the “how” of machine learning to the “what” of our results.
By examining the relationships between floor area, energy use, and construction age, we uncover the specific fingerprints of Boston’s multifamily stock.
Visualizing the Segments
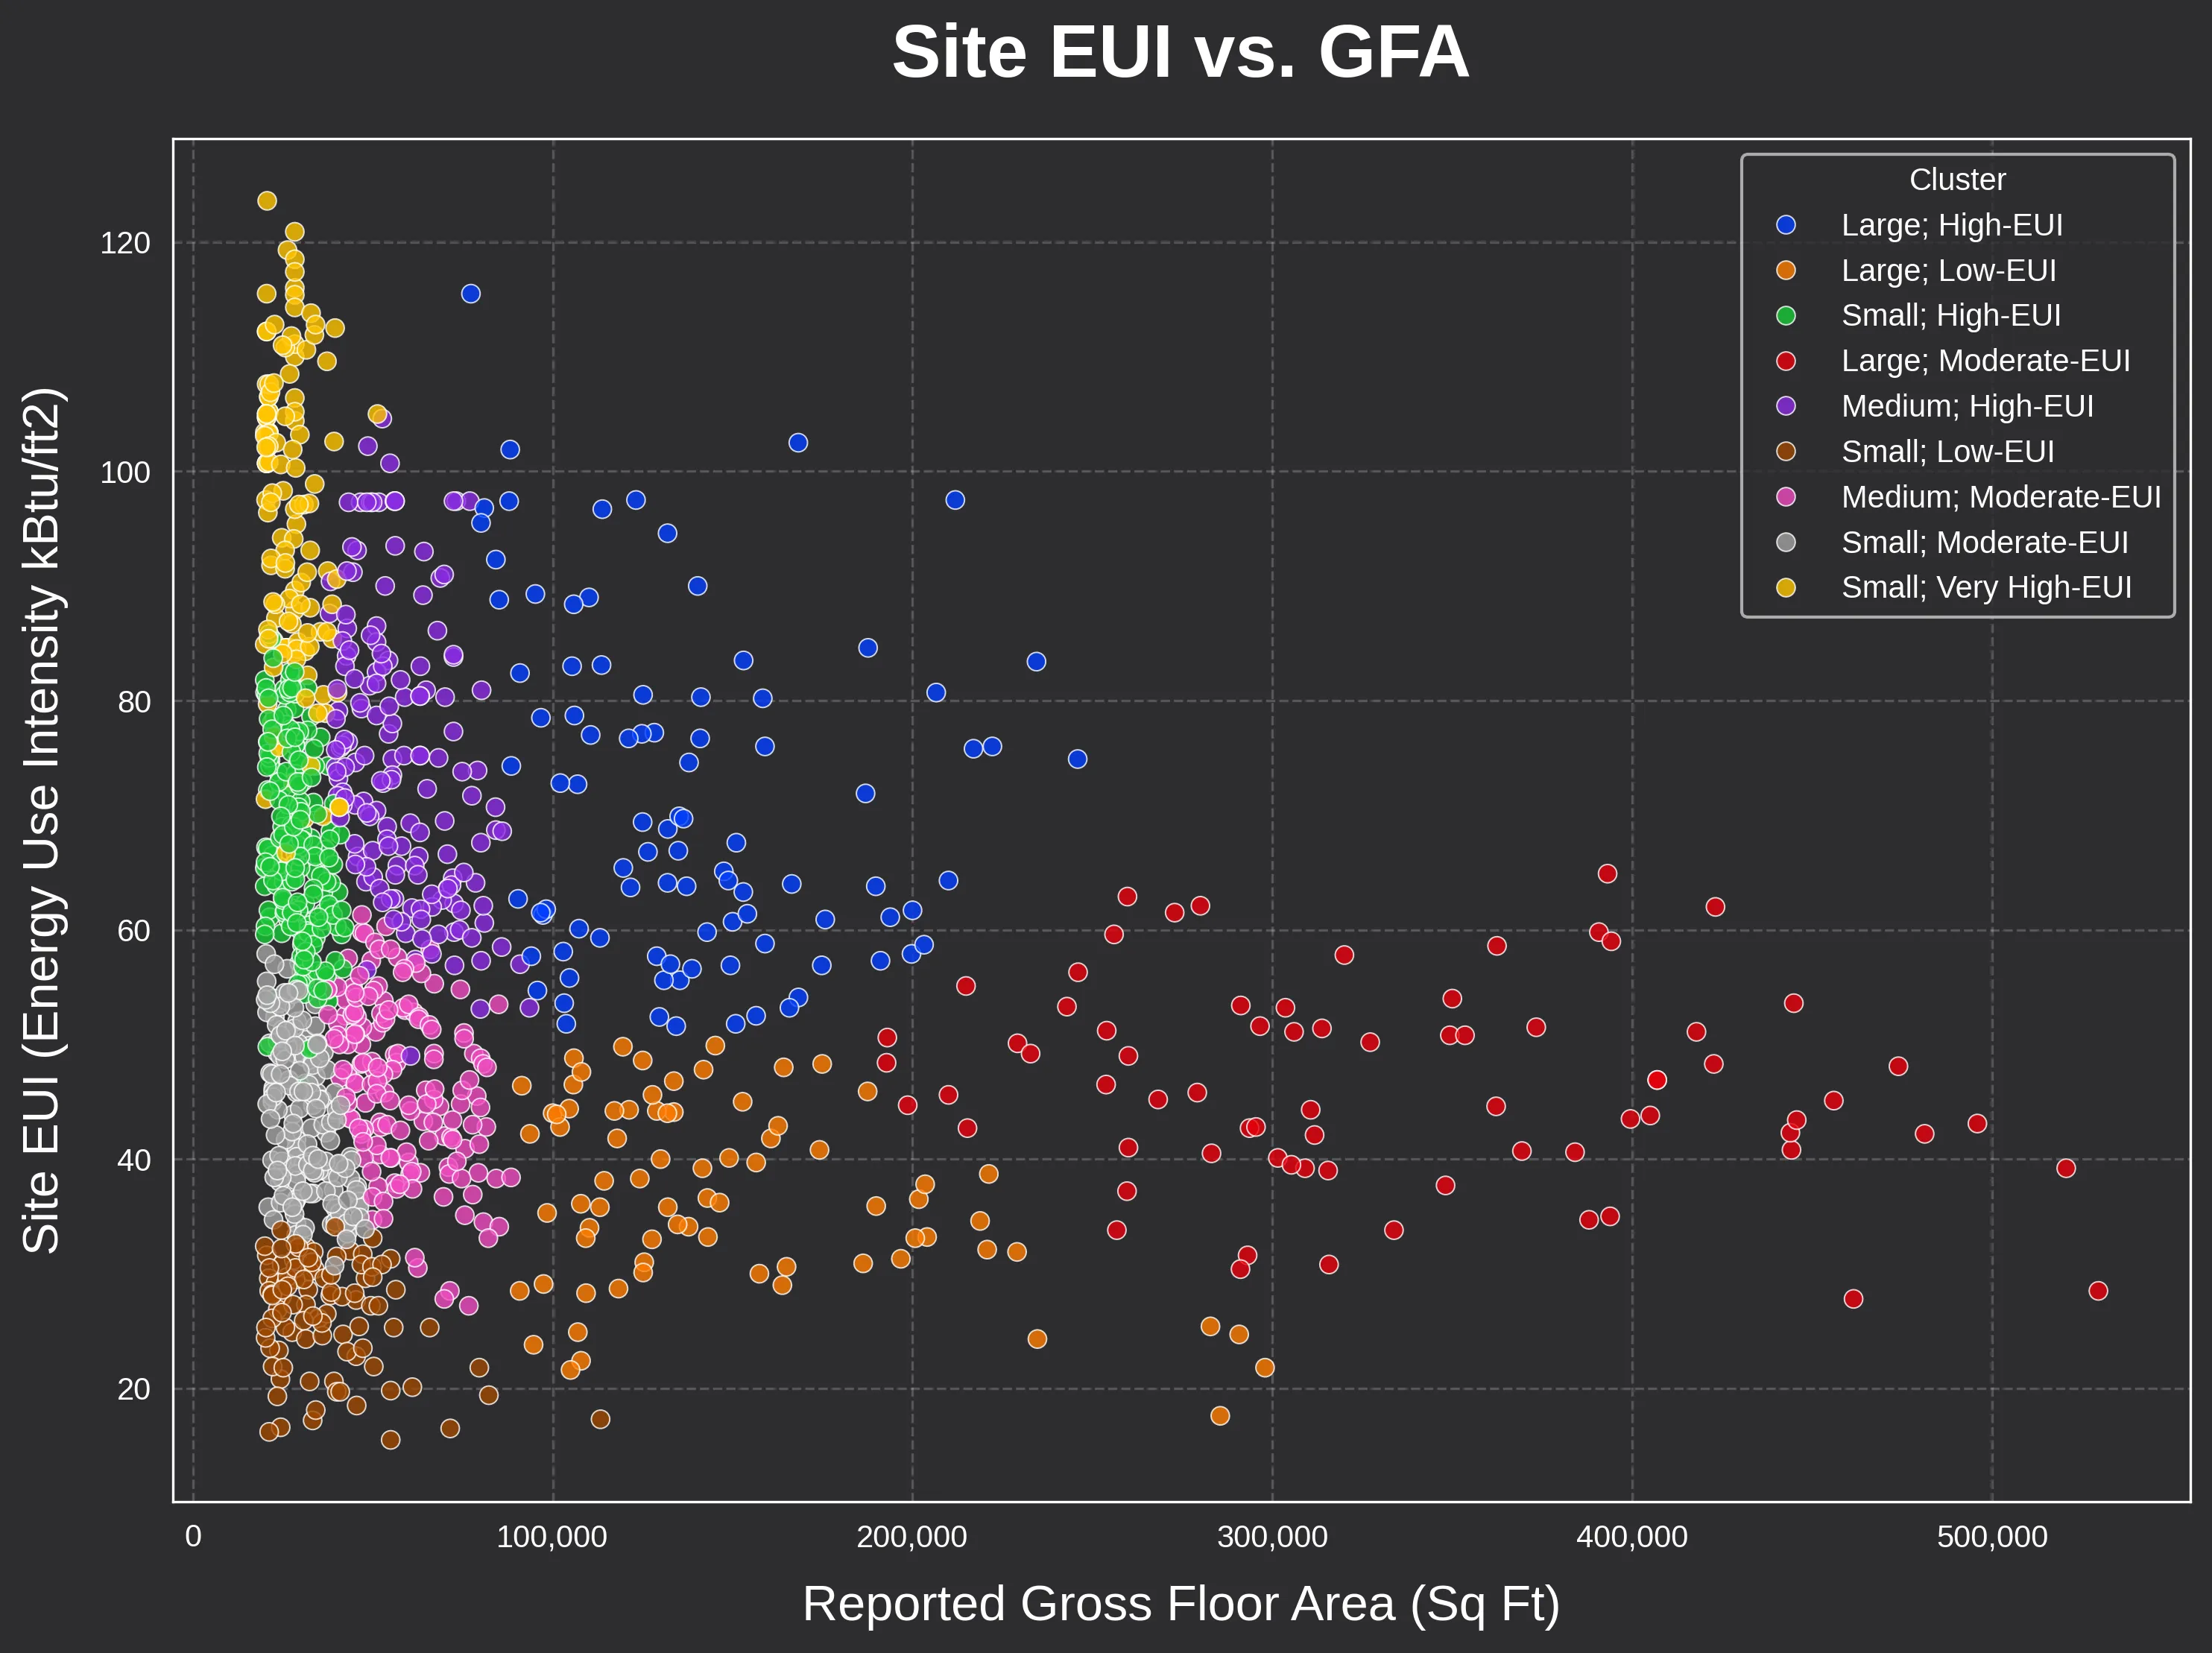
The most intuitive way to see these groupings is through a direct comparison of size and energy intensity.
In the scatter plot below, notice how the algorithm successfully draws clear boundaries between high EUI outliers and the more efficient core of the building stock across building size ranges.
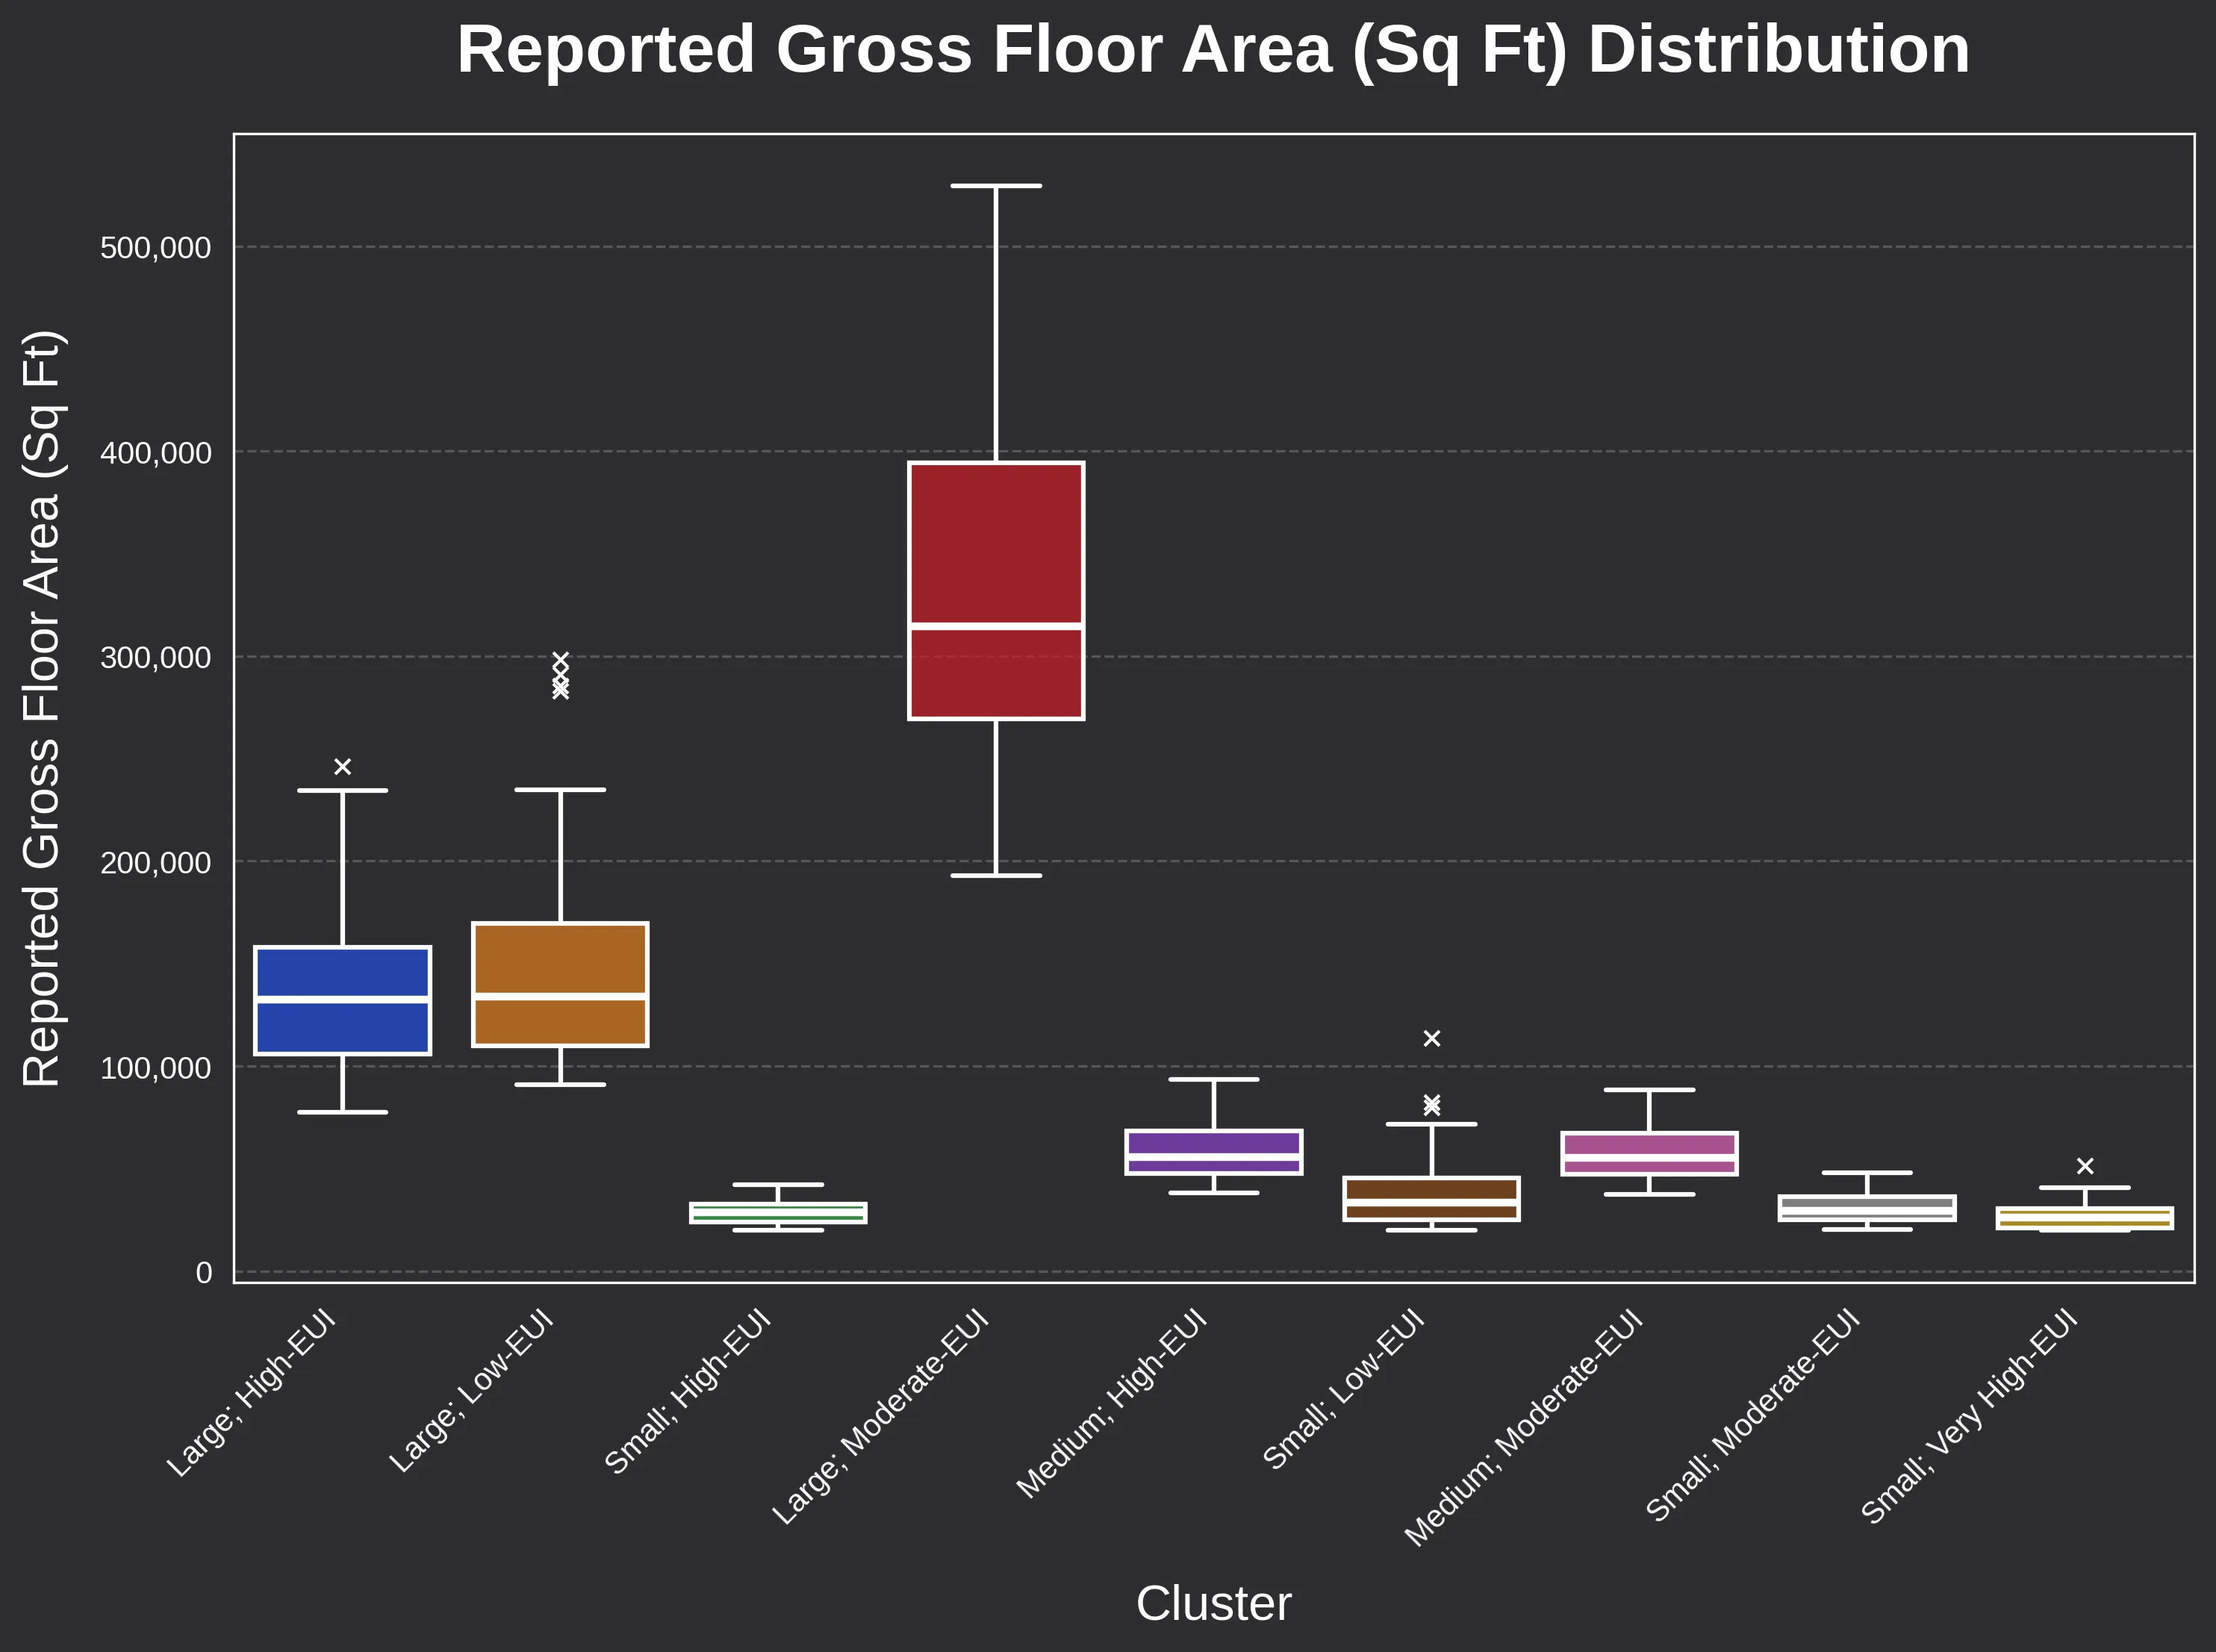
Metric-Based Differentiation
Boxplots of Site EUI and floor area confirm that these clusters are quantitatively distinct.
We use site EUI as a proxy for GHG emissions in plotting, but both variables were used in building clustering.
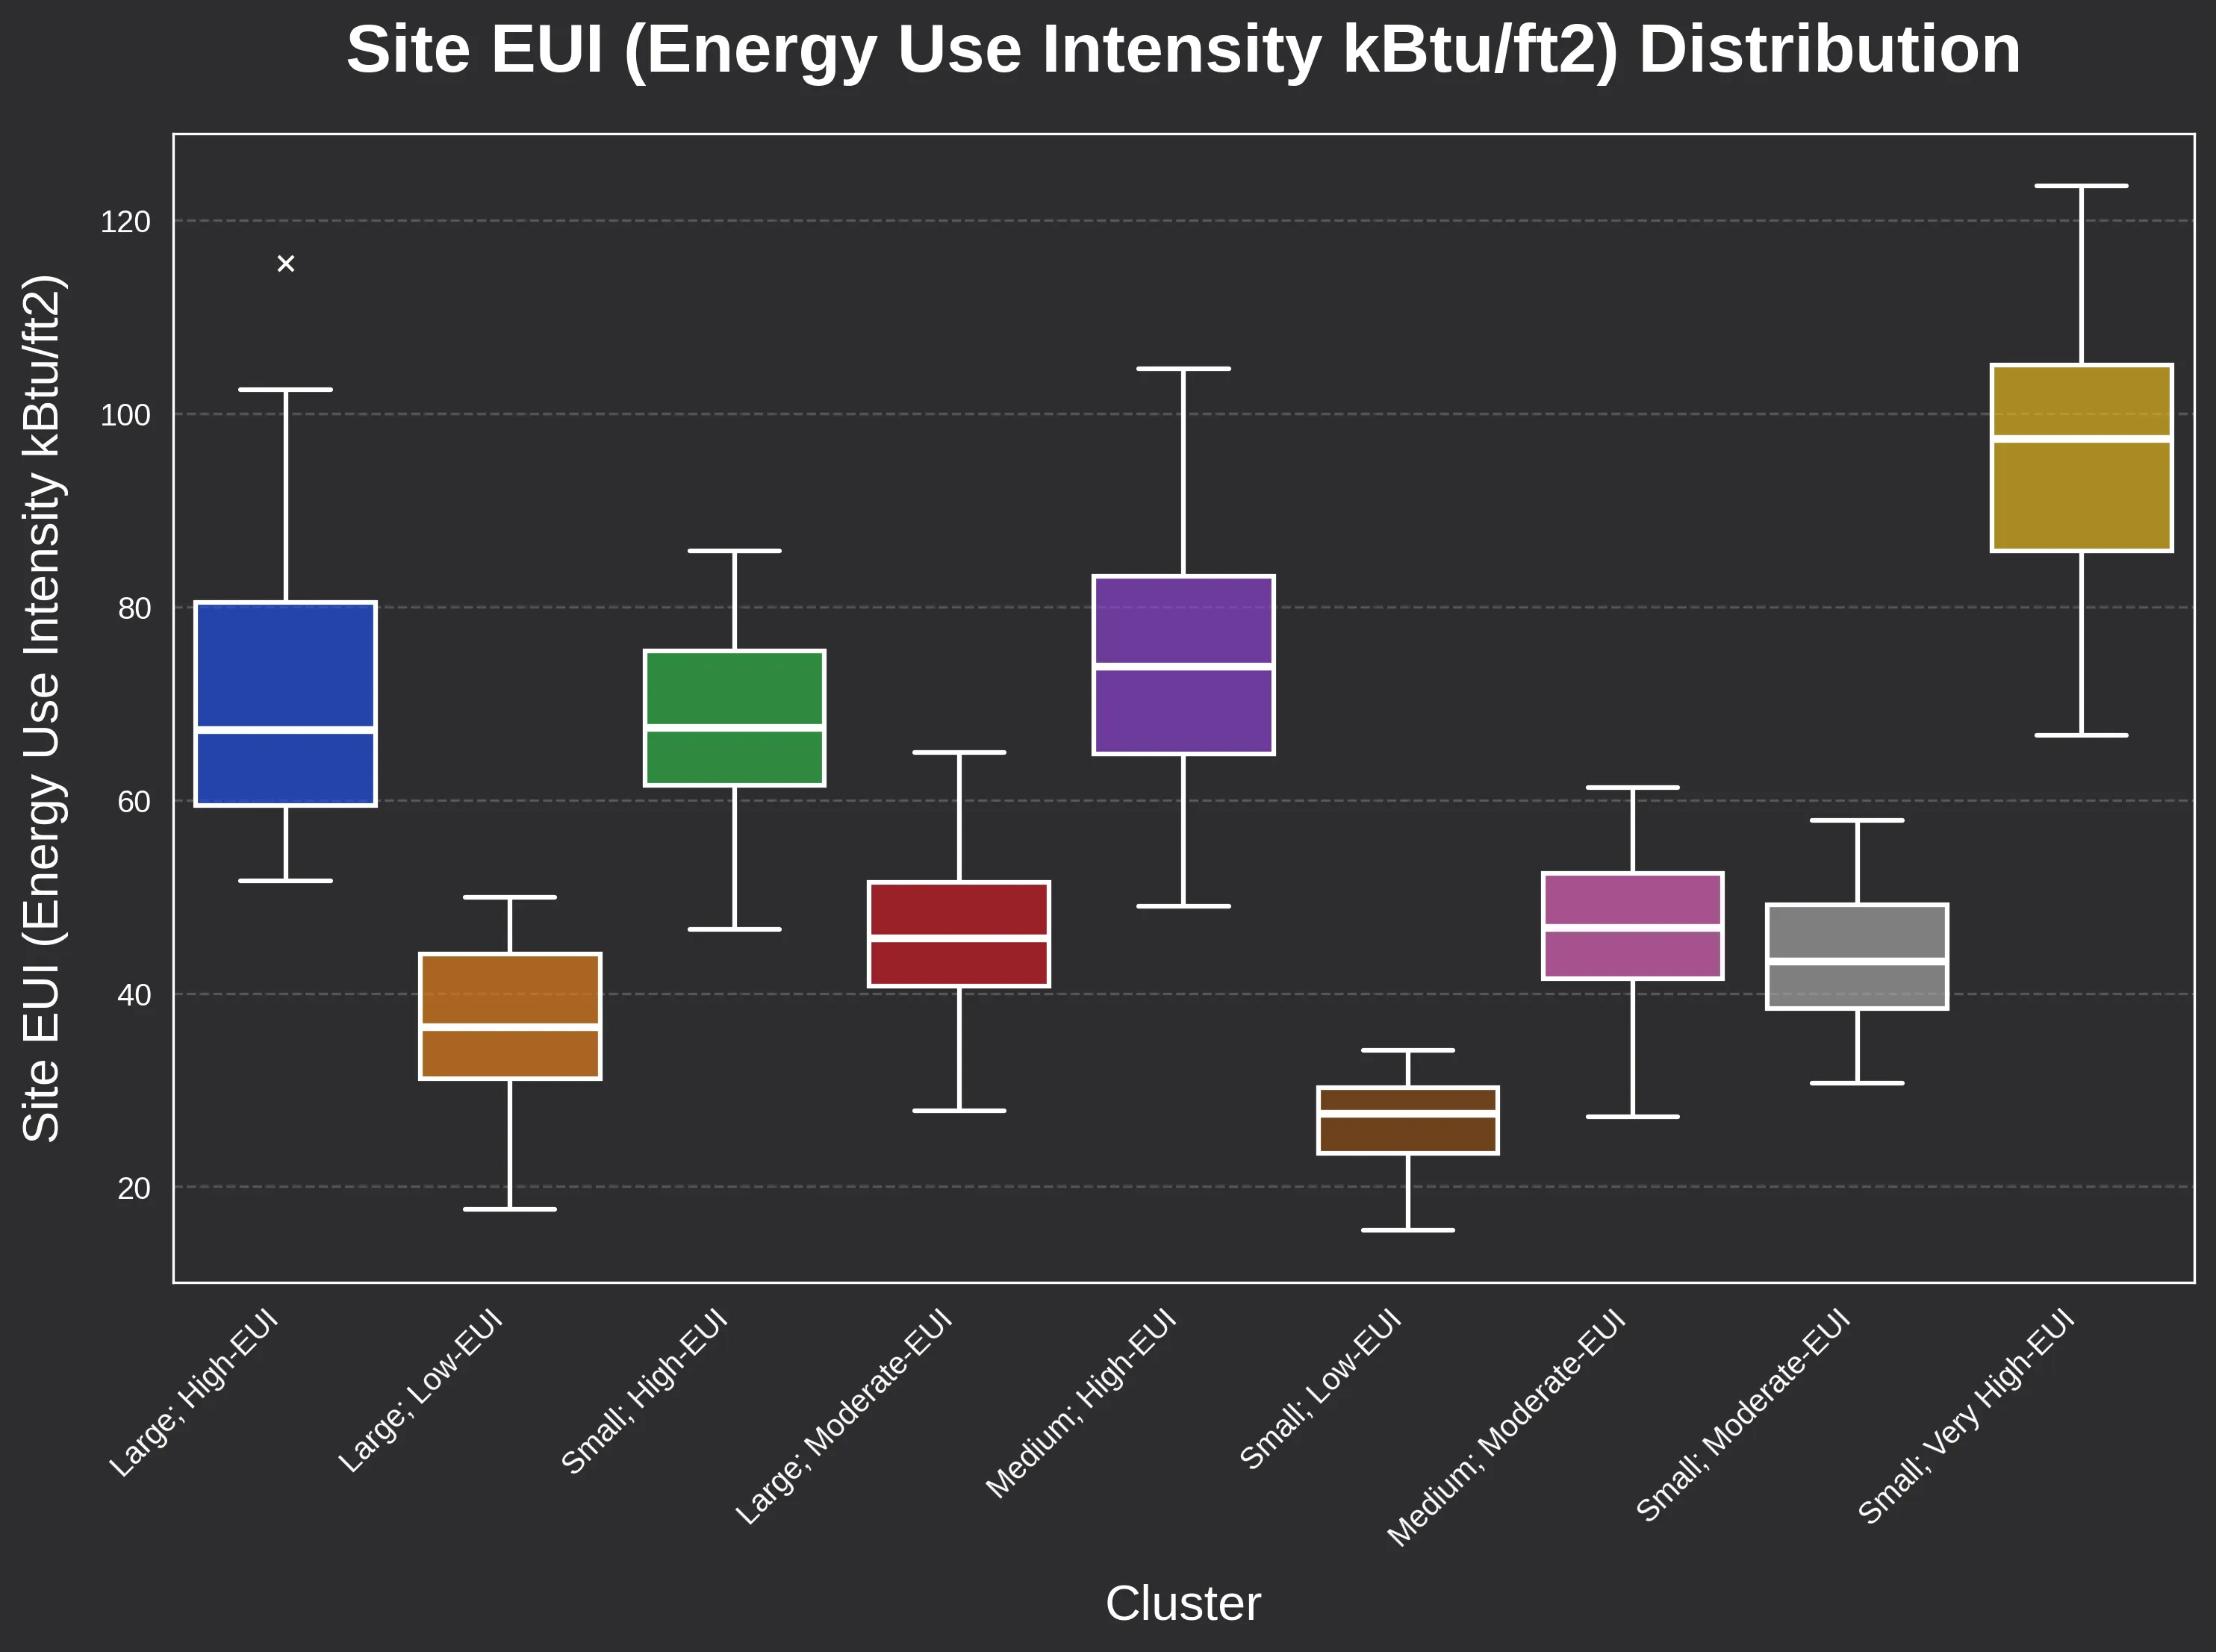
This separation is critical. It reinforces their utility as performance-based prototypes rather than just arbitrary statistical slices.
- Distinct Performance Signatures: Several clusters emerged with consistently low efficiency and high carbon emissions, representing the highest priority for immediate retrofit intervention.
- Size and Intensity Variance: The boxplots for Site EUI and Gross Floor Area (GFA) show clear, non-overlapping medians across the clusters, providing a clean set of targets for building science modeling.
The “Vintage” Variable
While we often use a building’s age as a proxy for its performance, our analysis of the “Year Built” boxplot reveals a more complex story.
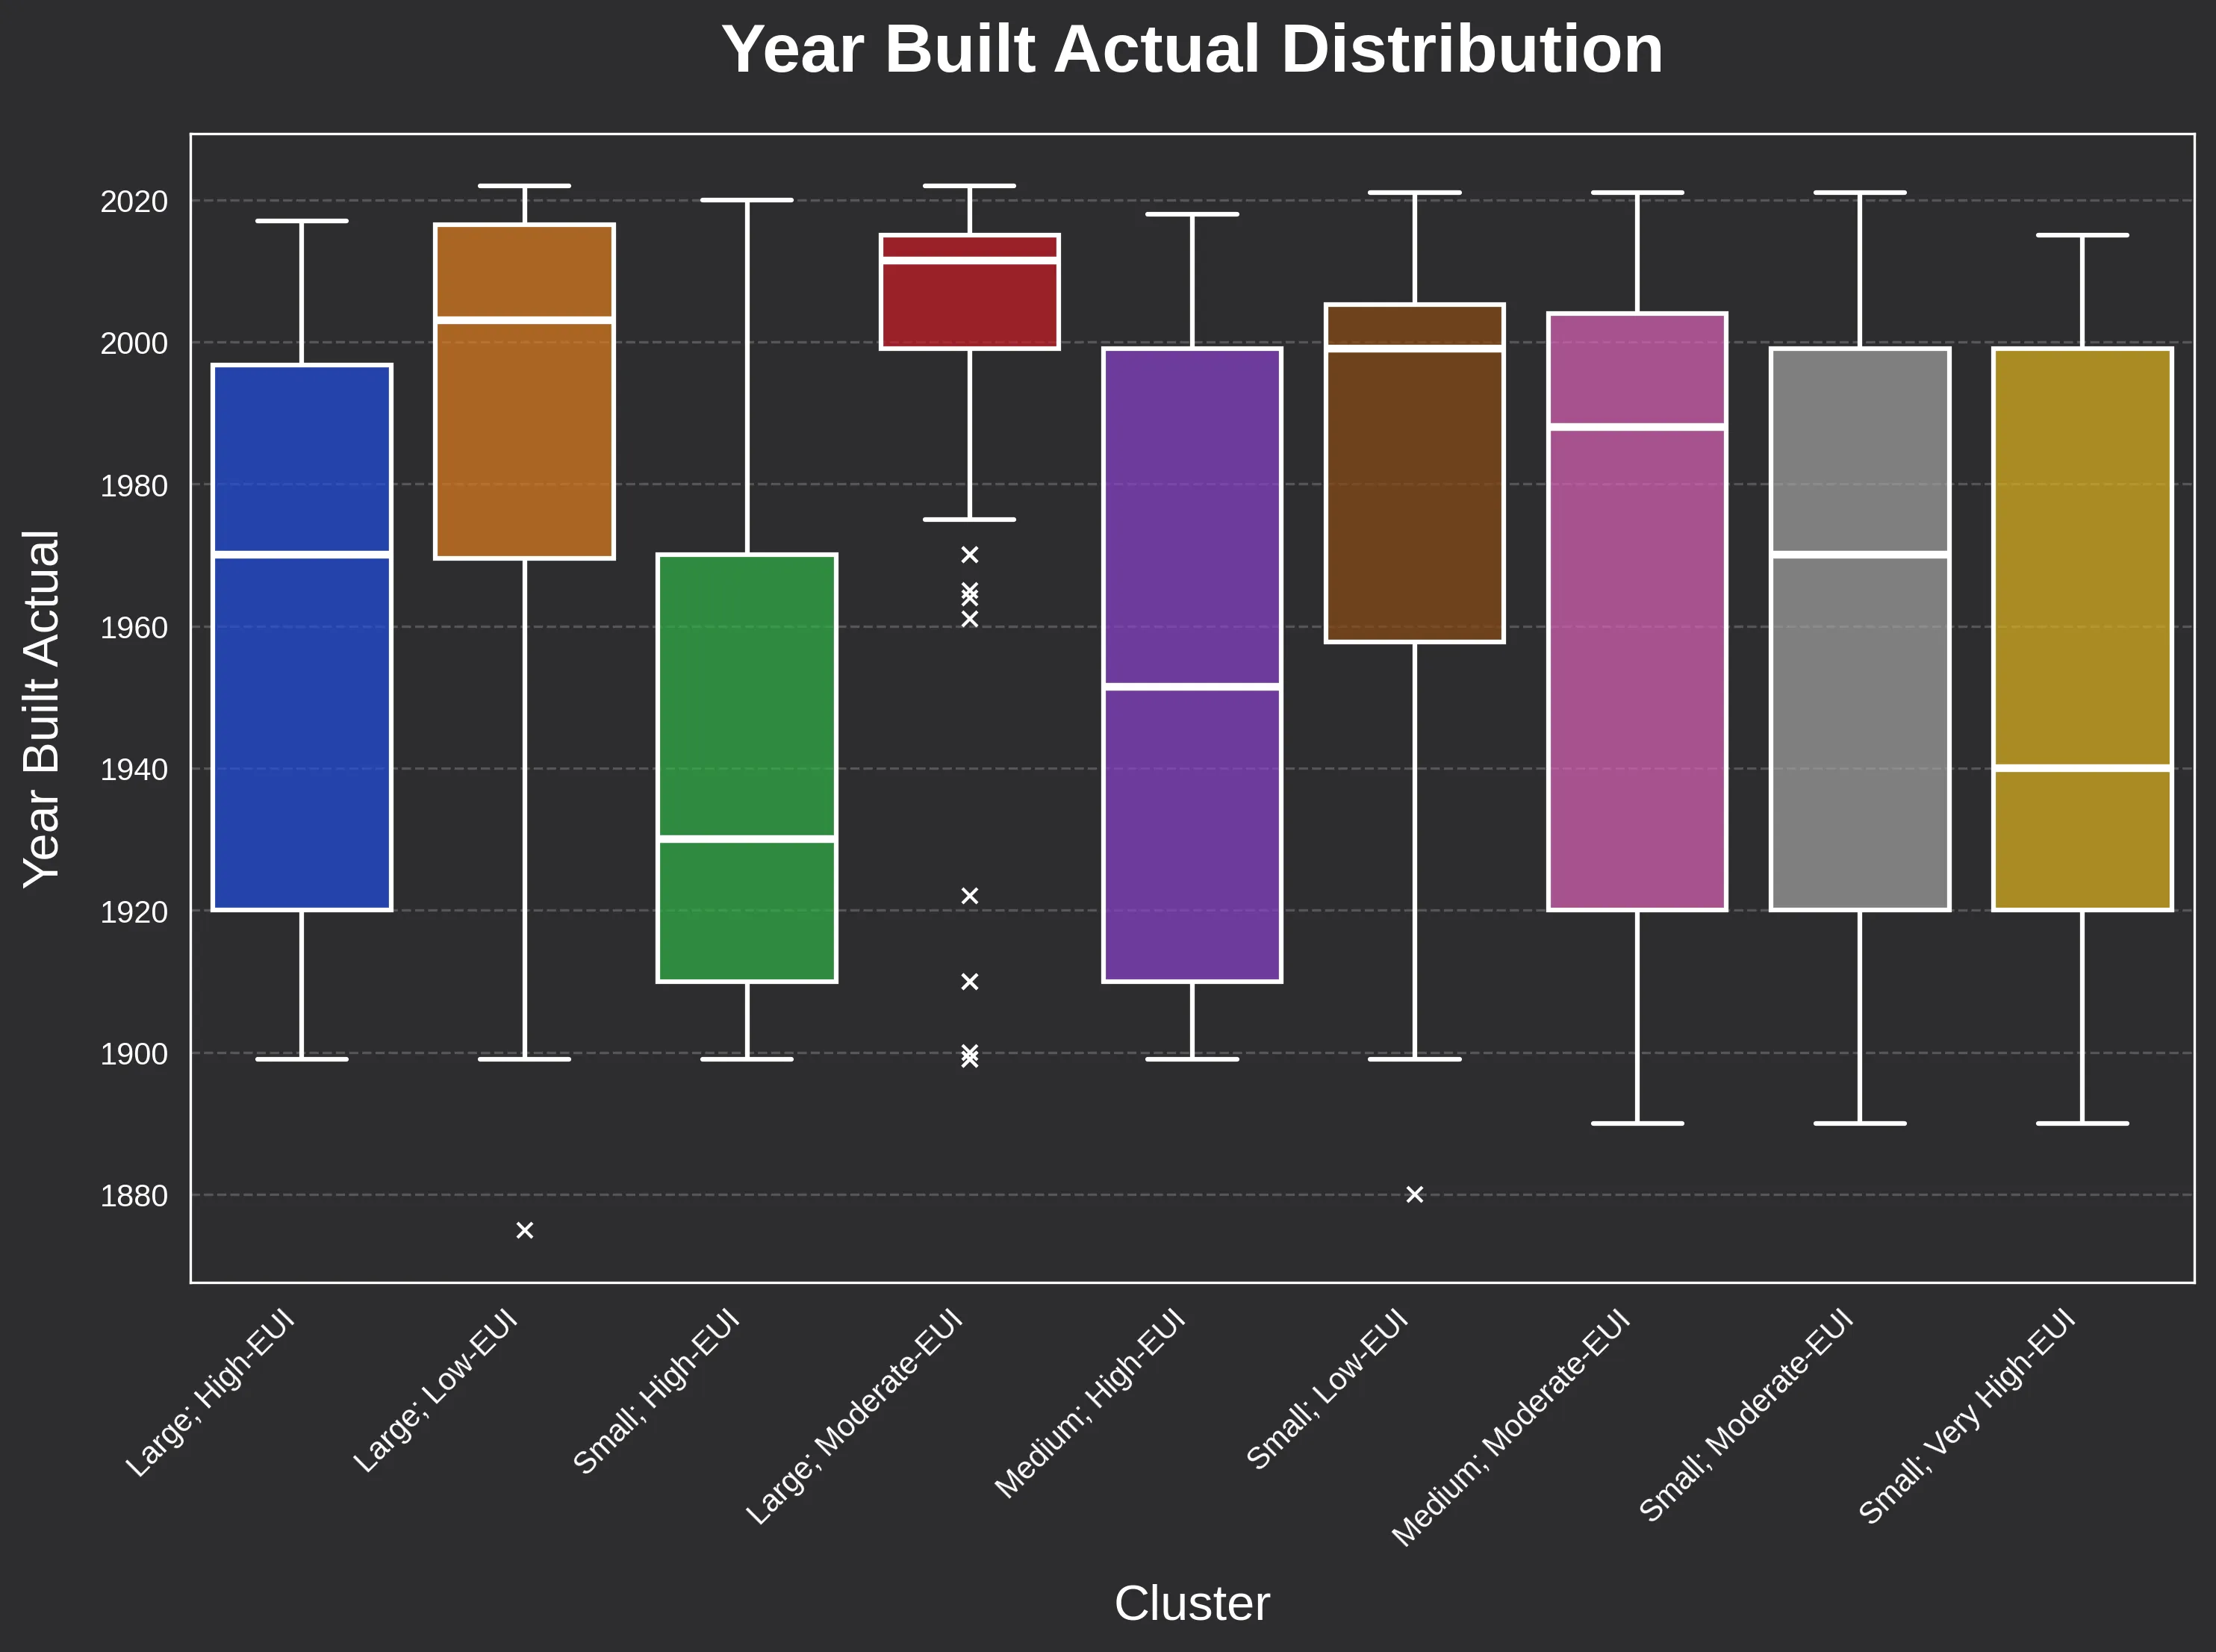
- Historical Trends: There is a certainly some correlation between construction era and efficiency at cluster medians (e.g. pre-1940 buildings are often found in the lower-efficiency clusters).
- The Power of Variability: However, the year-built data shows significant variability within individual clusters.
This proves that construction age is not the sole indicator of energy performance. A buildings “life,” including maintenance history and past retrofits, can matter as much as the year the foundation was poured.
Strategic Implications & The Enverdex Mission
The prototypes identified in this analysis are interpretable, representative, and scalable, indicating a clear path forward from raw reporting data to simulation-ready archetypes.
By grouping buildings based on their actual energy fingerprints rather than just age or zip code, we move away from the “average trap” and toward precision retrofitting and decarbonization at scale.
Each prototype now serves as a high-fidelity foundation for for the technical and financial modeling required to navigate the modern regulatory landscape:
- Targeted Retrofit Optimization: We can apply specific Energy Conservation Measures (ECM) packages (like heat pump conversions or envelope upgrades) to a prototype and project the impact across its entire cluster.
- Mitigating Financial Risk: These archetypes allow for accurate estimates of the capital required to avoid steep BERDO 2.0 non-compliance penalties, ensuring owners aren’t caught off guard by escalating costs.
- Strategic Capex Allocation: Data-driven insights reveal where technical intervention is needed most, allowing for a prioritized deployment of capital where it will have the greatest impact on both utility costs and regulatory standing.
Optimizing Building Performance with Enverdex
While the regulatory landscape of BERDO 2.0 presents a significant challenge, it also offers an unprecedented opportunity to redefine building performance through data.
At Enverdex we are currently in development of a high-resolution benchmarking and retrofit optimization platform designed to bridge the gap between complex municipal datasets and actionable capital investment strategies.
Our approach moves beyond basic compliance, focusing on three core pillars for asset owners and managers:
- Precision Benchmarking: Moving away from broad city averages to compare your assets against specific, data-driven prototypes.
- Capex Optimization: Leveraging multi-objective optimization to identify the specific combination of retrofits that maximizes utility savings while minimizing upfront investment.
- Risk Mitigation: Developing tailored roadmaps that attack the threat of financial penalties and reduce long-term utility overhead.
If you’re interested in seeing how this level of data science can optimize your portfolio’s financial and energy performance, we’d love to connect.
Visit our website to learn more about our mission or fill out our contact form to stay informed on what comes next at Enverdex!